
Strike Overview
- YouTube Ads Benchmarks are crucial for advertisers, serving as a compass to reach Connected TV viewers and mobile device users for personalized advertising. With YouTube’s status as the king of video content across all devices, analyzing these benchmarks has never been more critical.
- To help advertisers make sense of these trends, Strike Social’s YouTube Ads Benchmarks in 2023 aim to do more than just present numbers.
- They aim to help advertisers understand how changes in content consumption, platform innovations, and emerging industry updates influence these metrics.
Jump to Section
2023 YouTube Ads Benchmarks to Optimize Your Advertising Roadmap
YouTube’s expansive reach on multiple screen sizes and its versatility in content formats make it America’s leading video advertising platform. In Q2 of 2023, eMarketer reported that 45% of YouTube viewership came from big screens, allowing brands to capitalize on household co-viewing behaviors. Additionally, YouTube Shorts has become popular and is driving engagement and conversions, making it a unicorn for YouTube marketers.
To provide valuable insights into YouTube ads’ average view rate, cost, and performance, we present the 2023 YouTube ads benchmarks for brands and advertisers to set realistic goals and measure success in your next advertising year.
Understanding YouTube Ads Metrics That Matters
When assessing your YouTube ads, having clarity of the core metrics is essential. Whether you are just starting or a seasoned media buyer, understanding key YouTube ad metrics is necessary.
While view count may seem straightforward, other benchmark factors profoundly impact costs and results. This section will uncover the other critical YouTube advertising metrics for a fuller picture.
The 4 Essential Metrics Beyond Views for YouTube Ads Success
1. Cost per View (CPV): To some advertisers, the media costs are the heart of the campaign. It directly impacts your campaign’s overall cost-effectiveness and ROI. A lower CPV means you’re getting more eyeballs on your ad without exceeding the budget.
2. View Rate (VR): View Rate is a key performance indicator (KPI) in digital advertising that measures the effectiveness of a video ad in capturing the audience’s attention.
It is calculated using the formula VR = Views / Impressions. In this context, “Views” refers to the number of times users actively watch or engage with an ad, while “Impressions” denote the total number of times the ad is displayed or served to potential viewers.
The View Rate thus offers insights into how compelling an ad is, indicating the percentage of impressions that successfully turn into views.
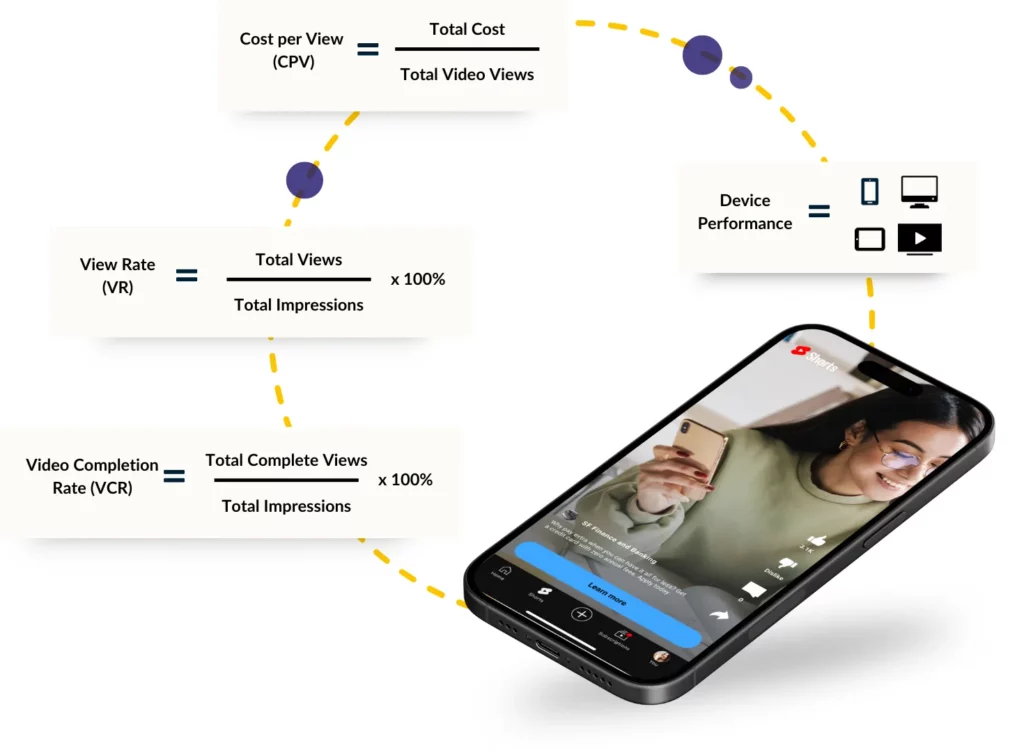
3. Video Completion Rate (VCR): The Video Completion Rate is calculated as VCR = Complete View / Impressions. “Complete View” represents the count of times an ad is watched from start to finish, while “Impressions” again accounts for the total number of times the ad is displayed.
This metric is instrumental in understanding how well an ad retains viewer engagement from beginning to end. A high VCR indicates that the ad content is compelling and relevant enough to keep viewers engaged until the end, highlighting its effectiveness in conveying the intended message or call-to-action (CTA).
4. Device Performance: The report shows how well your ads work across various devices—smartphones, tablets, desktops, and TVs. This metric can tell effectivity and efficiency because the “Cost of YouTube ads” varies by device due to differing user engagement levels. It helps you tailor your content and bidding strategy to where your audience is most engaged, maximizing your ad spend efficiency.
Further Reading
Adding Google TV Ads for Your YouTube Strategy
Connected TV is now evolving with the addition of Google TV ads, offering a new way to enhance your YouTube campaigns. With access to YouTube’s vast audience and the ability to reach households through large screens, this platform opens doors to greater visibility within Google’s expanding advertising network.
A Comparative Analysis Using Strike Social’s Industry-Specific Benchmarks
“How much does a YouTube TrueView Instream skippable ad cost?”
“What is the average view rate for YouTube ads?”
“What is a good view rate for a YouTube ad?”
These are questions that media buyers encounter at the onset of a campaign. However, it’s important to note that no one-size-fits-all answers to these inquiries exist. Each industry behaves differently, as well as audience behavior, competition in the auction, content relevance, or even video ad length.
In this section, we’ll unpack Strike Social 2023 YouTube ads benchmarks by industry, comparing and contrasting how different sectors stack up regarding ad costs (Cost per View) and VTR (View Through Rate).
We will break down the data to equip every level of advertisers, agencies, and marketers with insights to tailor strategies effectively.
Business and Finance 2023 YouTube Ads Benchmarks
2023 proved a transformational year for most financial companies. The growth of Fintech operations means moving away from traditional banking. This trend leaves more opportunities to expand their presence digitally.
Business expansion isn’t only happening to big companies; even startups are moving up the ladder in fintech competition. For both, YouTube delivered the digital real estate and tools to execute ambitious growth plans.
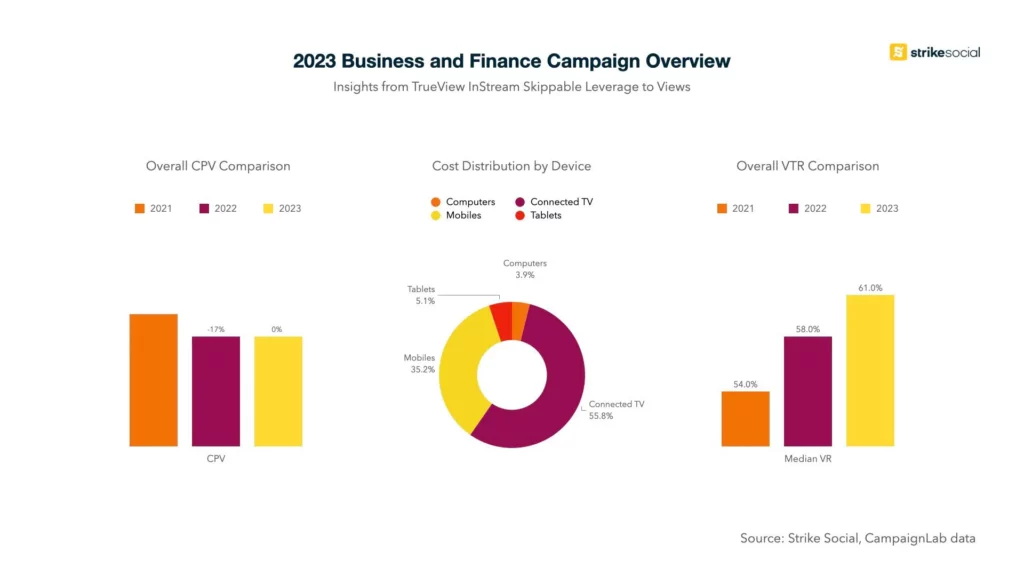
Strike Social’s Business and Finance data set for Instream Skippable ads produced a significant shift towards more cost-efficient YouTube ads campaign management, with CPV dropping 17% from 2021 to 2022. Our 2023 numbers reveal remarkable consistency as CPV held steady year-over-year.
Equally positive is rising engagement – VTR climbed from 54% in 2021 to 61% in 2023. The VTR trend indicates that finance-focused creative resonates well. Tailored video that speaks to specific consumer pain points around loans, investments, and more is getting results.
Healthcare and Insurance 2023 YouTube Ads Campaign Overview
Two healthcare and insurance industry trends accelerated by a mile last 2023. Three of every 4 American patients are comfortable utilizing Telehealth, while Limra forecasted a 5% U.S. retail life insurance premium growth after a bullish 2H 2023. This digital transformation opened new avenues for these industries to connect with their audiences more effectively and personally.
According to Strike’s 2023 Healthcare and Insurance data, the industry experienced a 27% decrease in CPV at the end of 2022. Subsequently, our data set displayed a significant increase of 49% last year. These fluctuations highlight the volatile nature of advertising costs in this sector. The trend exposes the industry’s persistent vulnerability to inflation caused by changing consumer behavior, regulatory changes, and the rise of digital-first new entrants driving demand.

Despite fluctuations in CPV, the engagement metrics provide a unique perspective. Unfortunately, 2023 saw a decline in VTR, the lowest in the past three years. However, this decline indicates a challenge in retaining viewer interest and effectively connecting with target audiences.
Addressing patients’ changing concerns and attention requirements in under 30 seconds, or the average attention span of 8.25 seconds for Americans, can be daunting. Nonetheless, we can effectively engage with our audience and maintain their interest by tailoring messaging to suit these concerns.
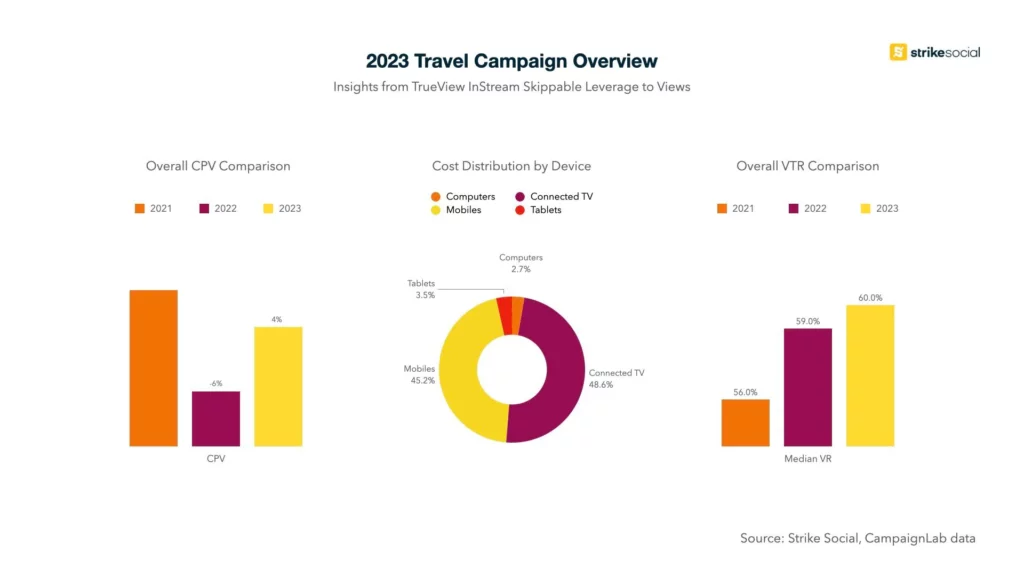
Travel 2023 YouTube Advertising Campaign Overview
Pent-up demand after years of restrictions drove a substantial rebound in travel interest entering 2023. The momentum spills to 2024, with $7.9 billion in digital ad spending forecasted. This surge in planning activity indicates fierce competition in the auction as brands target multi-generational travelers seeking both escape and value.
However, our Strike Social data reveals a picture of continued stability for the travel sector. Our numbers indicate that the average cost per view has consistently trended. While there was a 4% decrease in media costs from 2021 to 2022, we did notice a modest 6% increase in the previous year.
Positively, though, view-through rates for travel video ads continued ascending, reaching a 60% video completion rate (in views) in 2023. Brands seamlessly blend the emotional with the practical, likely to capture viewer attention best.
The travel industry is seeing success in shifting toward values-based tourism with a spotlight on wellness, eco-tourism, nature-based adventures, and holistic and wellness travel escapades.

Actionable Insights for Optimizing Your YouTube Ad Campaigns
When mapping your YouTube media plan, your goal is always to stretch your advertising dollar and maximize your campaigns’ engagement. Leveraging YouTube ads benchmark data has become an ace for advertisers, and marketers constantly seek ways to boost their ad performance.
Here are some strategies and tips to enhance your YouTube ad campaigns, focusing on cost-effectiveness and maximizing view rates.
Understand the True Cost of Running YouTube Ads
When planning your YouTube advertising budget, it’s critical to understand the true cost of YouTube TrueView Ads. With TrueView ads, you only incur costs when under these three conditions:
- Interacts with your video.
- When viewers watch the first 30 seconds of your video.
- Completing the video if it’s shorter than 30 seconds comes first.
If you have historical data, use it as a baseline for future campaigns. Check our blog or contact us for industry benchmarks to discuss current YouTube ad cost trends.
Remember that costs vary based on factors like the targeted audience and competition. Thorough research and planning will ensure the creation of a successful ad campaign.
Leverage Benchmark Data
Strike Social benchmark data for 2023 YouTube Trueview InStream Skippable ads provide valuable insights into industry standards for key metrics like CPV and VTR. 2023 benchmark data can be leveraged to set realistic campaign goals, evaluate performance, identify optimization opportunities, continuously monitor progress, and make informed decisions about YouTube ad campaigns.
By comparing campaign metrics against the benchmarks and making data-driven adjustments, advertisers can enhance their reach, relevance, and overall effectiveness, leading to improved YouTube ROI.
Contact Us
Partner with a SWAS (Software with a Service) AdTech agency and unlock 10-20% better campaign results.
Discover how Strike Social can be an extension of your in-house team.
Optimize for View Rates
When maximizing view rates, it’s all about creating content that genuinely connects with your audience. High view rates can lead to increased engagement and lower CPVs, thanks to YouTube’s algorithm favors content that keeps users engaged.
The key to surpassing the YouTube ads benchmarks? Crafting ads that are not only compelling and relevant but also entertaining. To do this, test different hooks in the first few seconds of your ad to see which captures your audience’s attention the best. And once you have their attention, keep it by using storytelling and clear calls to action.
By applying these strategies and tips, you can enhance the effectiveness of your YouTube ad campaigns, ensuring that you’re not only reaching but also engaging your target audience efficiently.
Win YouTube Campaigns in All Device Size
As consumer viewing habits and ad solutions evolve with technological trends, remaining nimble and data-driven is imperative for brands seeking to attain and exceed YouTube ads benchmarks this year. The 2023 benchmark analysis spotlights the duality of YouTube’s advertising environment—spanning traditional long-form content on Connected TV to snappy and engaging shorts on mobile—and presents both challenges and opportunities.
Savvy advertisers will holistically map campaign objectives and high-value audience mindsets across screens to architect integrated video strategies. Advertisers with comprehensive benchmarks and a deep understanding of these trends are better positioned to craft campaigns that resonate across different viewer experiences.
As we reflect on the data and insights from 2023, the roadmap for 2024 becomes clear: success on YouTube will hinge on the ability to blend creative storytelling with strategic media buying, leveraging the platform’s versatility to meet viewers where they are, with content that captivates and converts.


