
April 9th, 2020
In late March I posted about rapid pricing changes in YouTube here. Here’s how the larger paid media story movie of 2020 will likely play out.
Unfortunately, a number of formerly consistent marketers will not be able to have any ‘keep the lights on advertising’ for the rest of the year. Who knows how many. Maybe it’s 20%.
Some marketers blinked a bunch of times and found their businesses and supply chains not in massive upheaval. Gaming companies, tech, cooking supplies, vitamins – they’re out there. Look at Wayfair’s incredible stock whiplash the past month. Turns out if people are going to work from home, they need desks and chairs. Let’s call this grouping of marketers another 20%-30%.
The 50%+ rest of the class are in their Waiting Rooms. Reduced budgets now. Expect a lighter summer. Hope for a revival in Aug-Sept & best case scenario, execute a Cross Channel Media Plan at roughly the same media mix.
But it won’t pan out that way. It can’t possibly.
The Tune-In Calendar Is Collapsing
Tentpole events, typically scheduled throughout 15 weeks, are being shoehorned into 5 weeks. In a best case scenario, they’re going to be competing for eyeballs with Q3 schedule
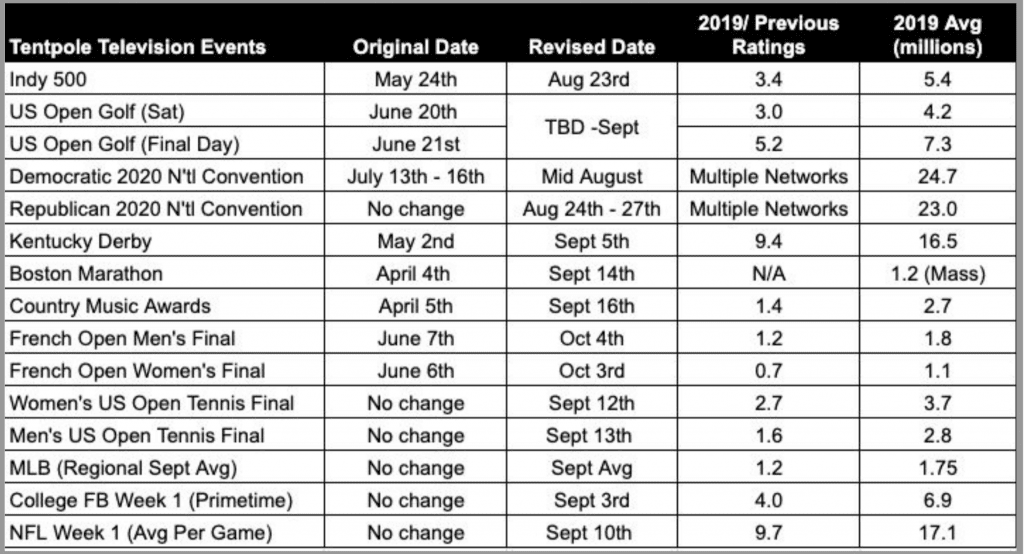
Some events, (NFL, Conventions) may emulate past performance. Overall the density of the tune-in calendar means ratings will be down on most individual events. A delay in new scripted programming means ratings will be off in standard broadcast and cable programming. Again, 20% down sounds realistic.
Add in more at home movie releases. More Netflix. More fragmentation. Rising CPM’s. Rising GRPs
PAC Money is Not Being Spent Yet
The SuperPac’s are largely holding on to their incredible war chest of financial reserves because right now the only news is Covid-19
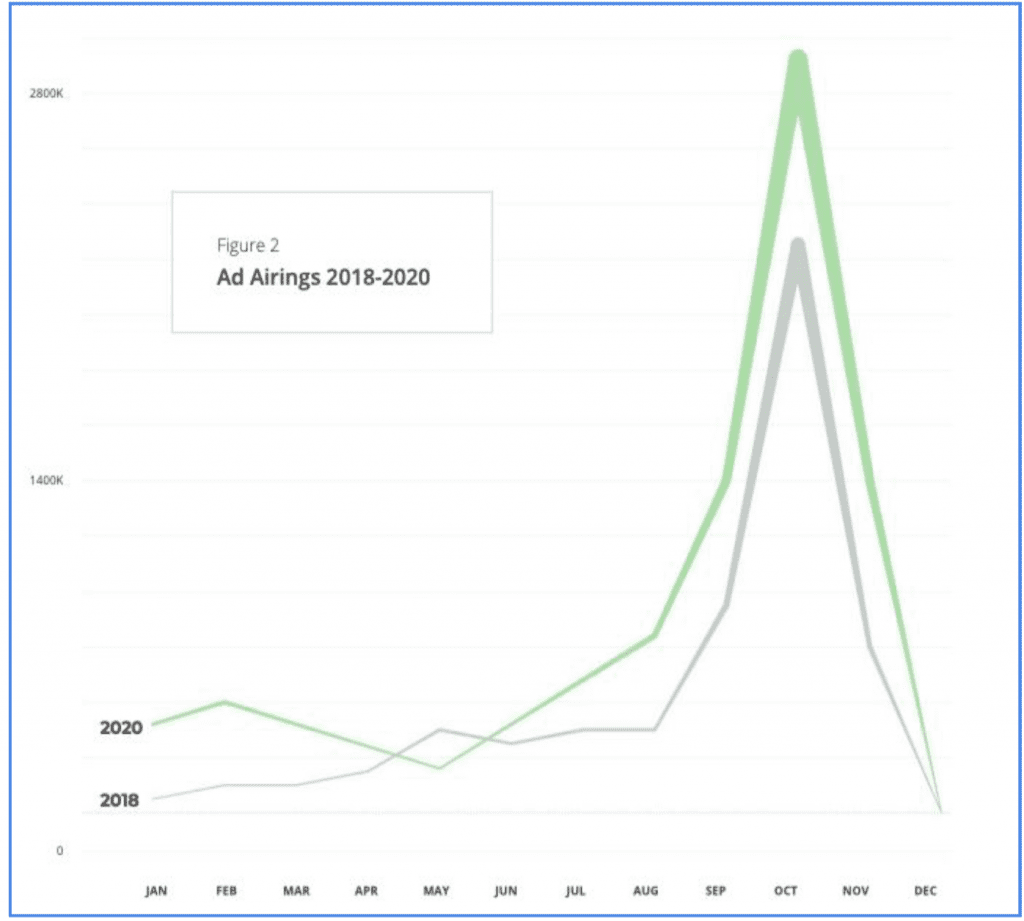
Political spending is expected to be 57% up from 2018’s political cycle: $3.26 Billion spend on Broadcast and an additional $1.02 Billion spent on Cable in 2020 ( source )
Some of that money was going to be spent in Q2. But now, almost all that money is going to start to hit in August and really September. Here’s expected airings.
The PAC’s aren’t taking this $ into 2021. It’s all getting used if it can.
Political Money Is Not Evenly Distributed
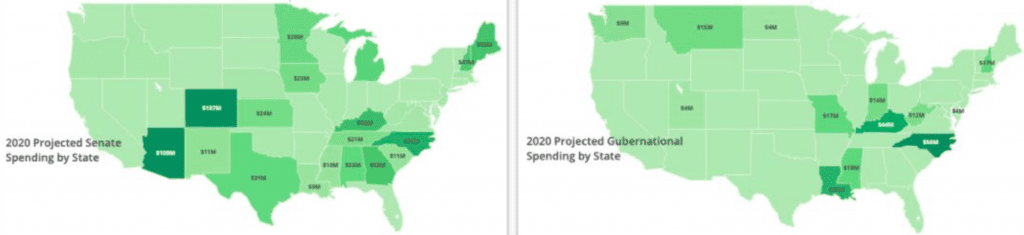
Many of the local DMA’s and states marketers may have on their plan overlap with the presidential political spending heatmap below:
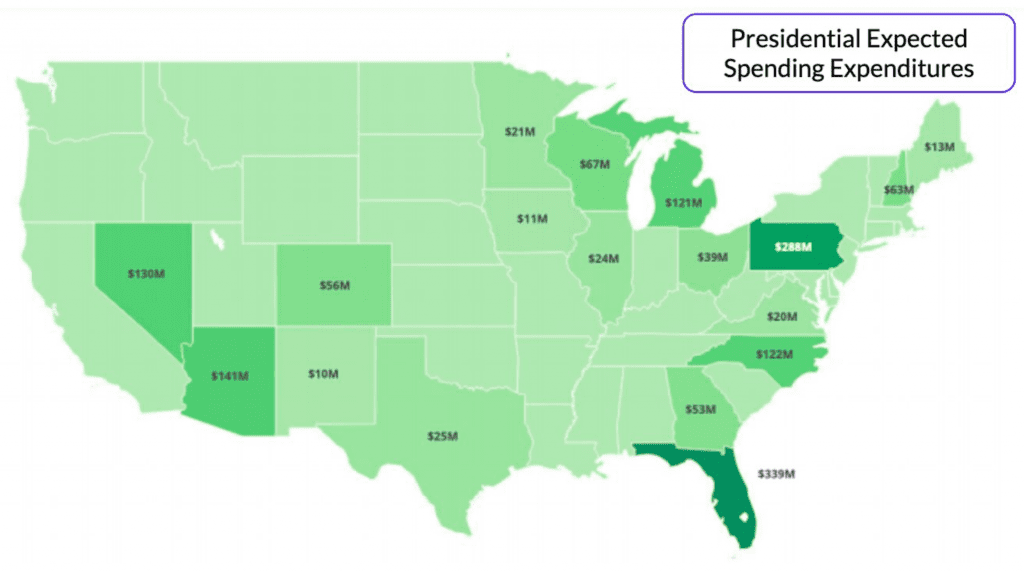
State Races / National Money
There’s going to Increased Investment in Senate & Governor Races. A state like Kentucky is not expected to see as much Presidential Race spend but it is expected to see $100M in ad spend between the Senate and the Governor’s Race. Louisiana, close to $50M. North Carolina between all the 3 races could see $250M.
Before COVID, Broadcast & Cable CPMs were expected to be up 13% and 11% y/o/y. Post Covid?
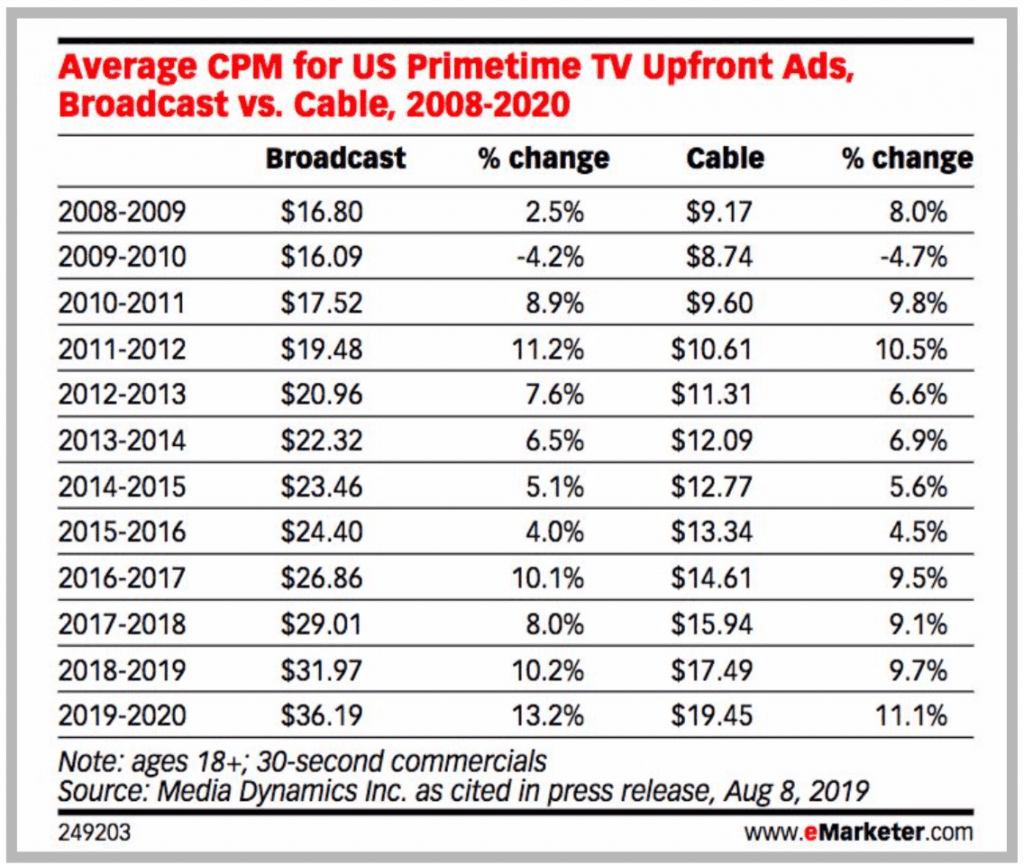
There will be an inevitable sharp rise in TV CPMs w declining GRPs. As Q3 minimums are not met and ratings fall, networks will look to fill commitments across all dayparts and tap into more OTT and CTV inventory. TV costs will quickly escalate
Expect To Hear the Term ‘Preempted’ a Lot
The Super Pac’s won’t care about media efficiencies. They’ll buy as many GRP’s as they can. Rating guarantees from the UpFronts will be challenged and more clients will see spots preempted in September and October.
Even with less traditional marketers in Q3, planning teams should anticipate volatility trying to maintain GRPs and what had been normal unique reach and frequency numbers.
Q3 Planning Advice: Similar To Vacation Packing Advice
There’s a saying when packing for a vacation, put all your clothes on the bed and all your money. Then take 1⁄2 the clothes away and double the money
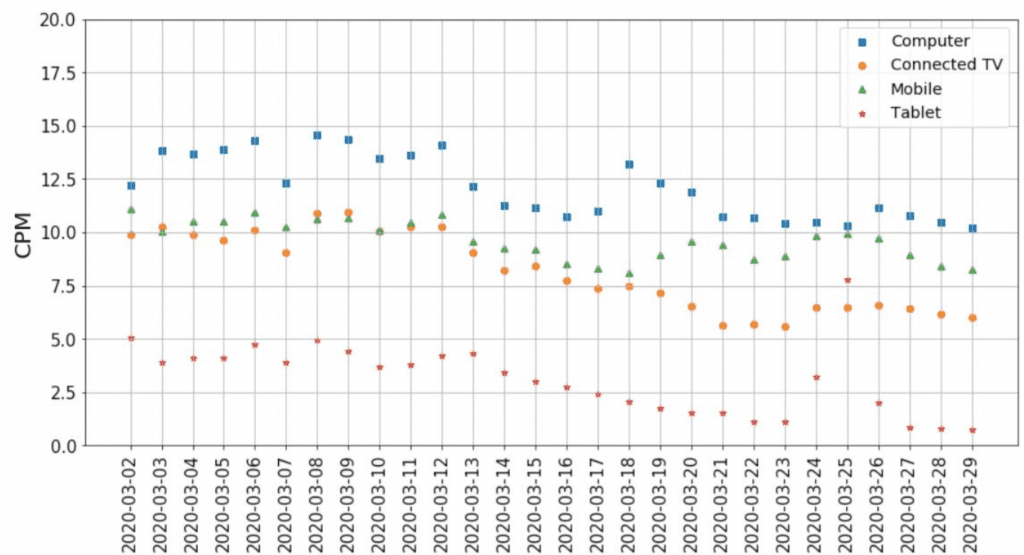
Digital on the plan. YouTube on your plan? Social video?New habits are being formed. The digital share should be larger because it’s the most stable, known commodity. YouTube’s unique reach against your audience is larger than any network. Facebook Watch is far more a channel of consequence. YouTube’s CPM’s on ConnectedTV for a completed view? Before COVID it was about $11. Right now in Q2, 2020 it’s closer to $6-$7. In Q3 let’s assume some normalization and it’s in the $9-12 range and a slight premium for local efforts. That’s 50% lower than TV was projected to be.
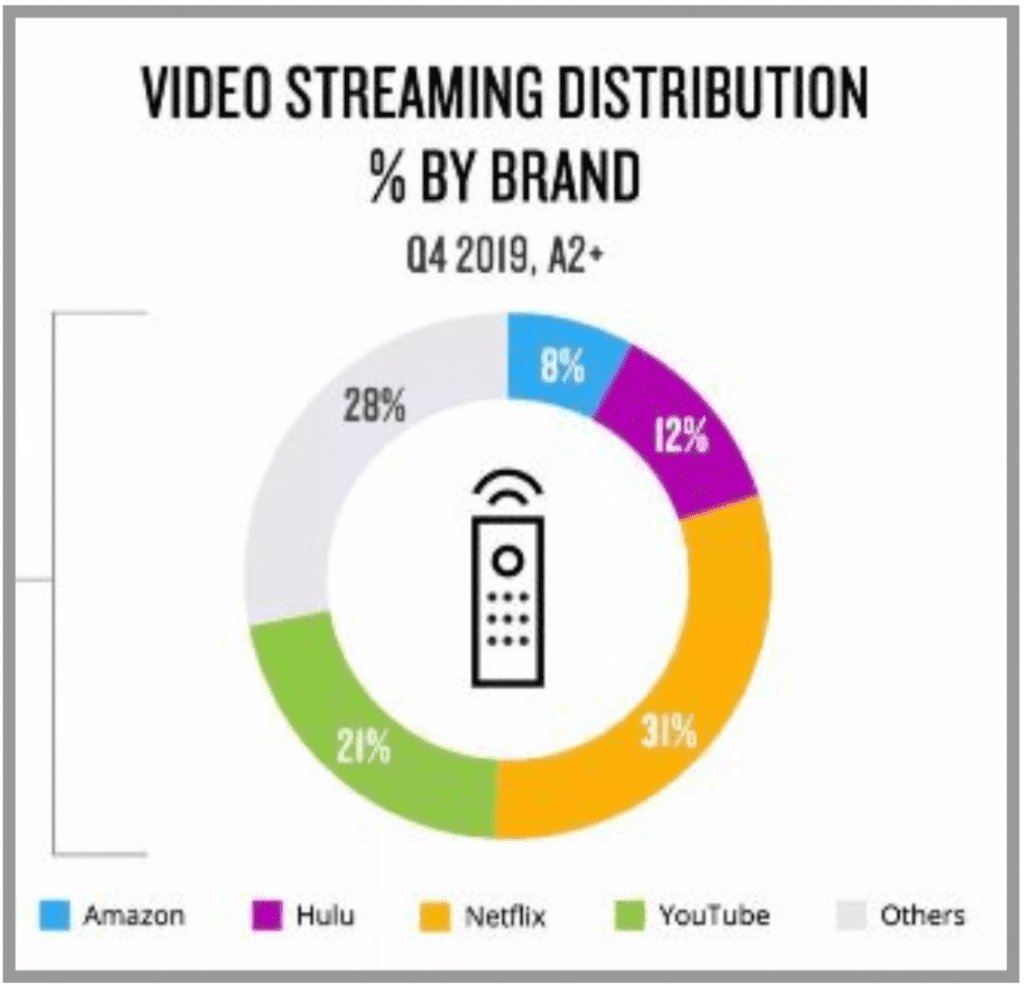
YouTube growth, part Covid but mainly CTV and overall platform related, makes it your most scalable channel on any medium. In my last piece we showed the 10x increase in YouTube WatchTime during Covid. In Q4, YouTube was 21% of all streaming content… and that includes Netflix which of course has no conventional marketing options ( source ). InQ1, it’s higher.
YouTube March CPMs. Strike data across verticals
Key Takeaways
- The media mix model you worked on in Q4 for 2020 planning is dated. That world changed with everything else. There are no historical forecasting models that can predict what will happen in the Q3 Broadcast & Cable markets. Past performance and pricing won’t be consistent. The scatter market will be very tight.
- Until post election, Digital is going to be the medium where scale is available. We’re biased but the data is there. YouTube may be the primary channel for reaching your audience and see what incrementality looks like cost efficiently. You can also plan TRPs on YT
- A YouTube Connected TV CPM is the most cost effective CTV CPM. By about 50%.
Please reach out to our team with any questions or activation considerations.
Thank you. Stay safe in there.
The Strike Social Team
- Winning Social Media Political Advertising Under 2026 Ad Restrictions

- Google Marketing Live 2026: 10 Key Announcements That Will Shift Paid Media Strategies
- How to Prepare for Amazon Prime Day Advertising in 2026
- Campaign Optimizer for Automated Campaign Management and Scaling
- DSA to AI Max Explained: Key Changes and Optimization Strategies
- Meta AI Business Assistant: Features, Use Cases, and Best Practices