

The capacity of social media advertising to influence users is growing by the year, and it becomes more relevant as consumers find more value in it. But the question remains, which paid social media platforms is performing better: YouTube vs. Instagram vs. Meta (formerly Facebook).
Zenith Media stated that social media will lead the advertising channel as the fastest growing platform, with an average annual growth rate of 14.8% between 2021 and 2024. The trend will continue to rise and eventually surpass television. In CTV advertising via YouTube, 49% say that ads are more relevant than cable TV.
YouTube and Meta: Why do brands depend on these social video platforms?
Not every social advertising platform works the same way. But each one of them is essential to every advertisers’ marketing strategy. Defining the ad objective and understanding the advertising channel’s capabilities will help you steer results in the right direction.
YouTube Statistical Highlights – Communal Viewership
Related: Download the YouTube global insights report
More likely, most household viewers have killed more time in front of the TV lately, watching tens and hundreds of short YouTube videos contents the whole afternoon. 2021 YouTube average viewing time has seen at least a 3% increase than the previous year, having an average of 29 minutes and 37 seconds per visit per user globally.
Now that most family members spend more time watching live streams, on-demand videos, or short video clips, brands invest more in video marketing. Statista.com projected an 8.4% increase in digital viewership by the end of 2022 compared to 2018, from 228.8 million to 248.9 million US video viewers. Nearly one out of four people mentioned that they watched via a co-viewing app last year, seeing an increase of 20% from 2020.
Let’s jump into the YouTube US Statistics and see what it has to say.
- 89% of advertisers choose YouTube to be their primary platform for video marketing.
- YouTube US Viewers are the most notable content consumer with total site traffic of 16.4%.
- YouTube is still the king of video content. Almost 95% of people who stream video content via OTT are YouTube viewers.
- YouTube offers a massive opportunity for marketers. Globally, the number of people who spend social media is roughly 4 billion. At the same time, more than 2 billion users engage with YouTube. US small business owners have yet to unlock their full potential on the platform. Only 9% of these proprietors utilize the power of YouTube.
Instagram Statistical Highlights – Young and Vibrant Audience
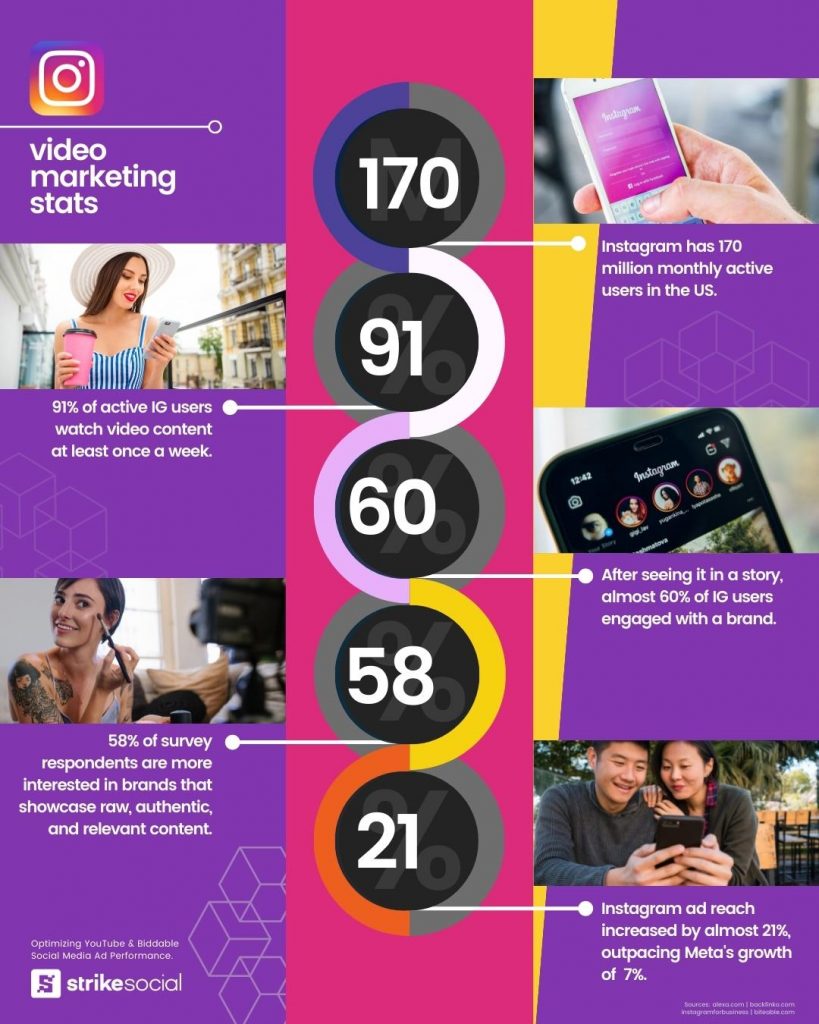
Instagram continues to shine among the young demographics and brands associated with the age group. Close to 63% of Instagram app users are 18-34 years old. The famous photo and short mobile program rank 4th in the most used social platform worldwide, logging 1,478,000 global active users.
A report shared by Merkle, businesses have allocated 28% of ad spend on Instagram Stories. Studies show that driving brand engagement through short and engaging videos has been rewarding for brands. The action resulted in an average increase of 29% Q/Q on impressions, making it an effective tool for advertisers.
Below are US Instagram statistics to help you understand how the platform can support the growing demand for brands and influencers.
- Checking into the US Instagram audience, there are 157 million registered users in the app and projected to grow by next year.
- 71% of US companies can be found on Instagram, more than doubling the 2015 numbers of 32.3%.
- 70% of Instagram viewers watch Stories with sounds on, resulting in 20% direct messages from engaged audiences.
Meta Statistical Highlights – Still the Social Media Giant

Different name, same dominance. Regardless of the change of brand, Meta, formerly Facebook, still holds the most extensive type of active users. During the 1st Quarter of 2021, Meta hit the three billion mark in Monthly Active Users using one of their platforms, Facebook, Instagram, WhatsApp, or Messenger, making it the first social network ever to do it.
Through Meta advertising, brands can produce a more personalized ad matching the target viewers’ interests and affinities. With Meta’s audience size, more companies run their ads on Meta for both seasonal and more extended campaign duration.
Meta ad auctions are challenging and volatile, but this remains the marketers’ top choice of paid social advertising. These informative statistics from Meta may explain why advertisers are still allocating more ad money to this platform.
- In 2021, Statista.com reported 302.28 million users in the United States. Recorded an increase of 5.06 million audiences, slightly lower than 2020 users growth with 6.65 million.
- Facebook’s Average Revenue Per User (ARPU) in the United States is more than thrice as Europe and Asia-Pacific. As of October 2021, Facebook’s ARPU in US and Canada listed a $52.34 value. In comparison, Europe and Asia-Pacific have $16.50 and $4.30 accordingly.
- Seven out of ten US adults visit Meta daily. Almost half of these users are checking for updates multiple times a day. In addition, approximately a third of adults Meta users in the US read their daily news using the platform.
Social Media Crown Bearer: YouTube vs. Instagram vs. Meta
None. Individually, these social platforms have their advantage in producing desired campaign results. A multi-platform strategy gives marketers a more continuous approach to promote a more positive advertising experience.
Considering every stage of the funnel, designing a paid social strategy can help amplify campaign reach, manage ad frequency, and develop compelling messaging for the right consumer.
Strike Social offers a granular approach in setting up paid social campaigns for a higher success rate. Learn more here.