
Strike Overview
- Are you curious about Facebook ad costs? Observations from digital marketing managers and forecasts indicate a consistent trend of increasing advertising investment in paid social media platforms year after year.
- In 2025, U.S. social media ad spend is projected to reach $92.56 billion, despite economic concerns and potential tariff-related slowdowns.
- Facebook remains a key platform, with high usage across all age groups, making it essential for advertisers to understand current cost trends.
Jump to Section
This post was updated in June 2025 to provide you with the latest information.
Breaking Down Facebook Ads Cost and How to Adapt Your Strategy
Digital agencies often prioritize metrics like Cost per Impression (CPM) for awareness campaigns, Cost per View (CPV) for video ads in Facebook Feed and Reels, and Cost per Click (CPC) for traffic-driven campaigns. At Strike Social, we align with this performance-focused approach to help advertisers make smarter decisions.
In this blog, we’ll break down the costs of advertising on Facebook, beginning with critical metrics, and offer expert tips on leveraging data for strategic campaign planning and optimizing ad spend. Whether managing multiple clients or aiming to boost your campaigns, this overview will equip you with the insights needed to maximize your Facebook advertising efforts.
How Facebook Ad Costs Are Shifting: 2024-2025 Trends
Understanding client expectations in the context of fluctuating ad costs can be a challenging task for digital agencies. By examining Facebook ad costs based on specific objectives, agencies can gain insights into budget allocation and better justify spending. Leveraging Strike Social’s ad cost benchmark can enable agencies to optimize their advertising strategy and deliver increased value to their clients.
How much is the Cost Per Impression (CPM) on Facebook?
CPM represents the cost for every 1,000 impressions your ad receives, and it’s a key indicator of how much you’re spending to get your ad seen by a large audience. CPM, or cost per thousand impressions, is employed when the primary goal is to maximize ad visibility. Knowing when to consider choosing CPM as a key indicator can significantly help understand campaign performance.
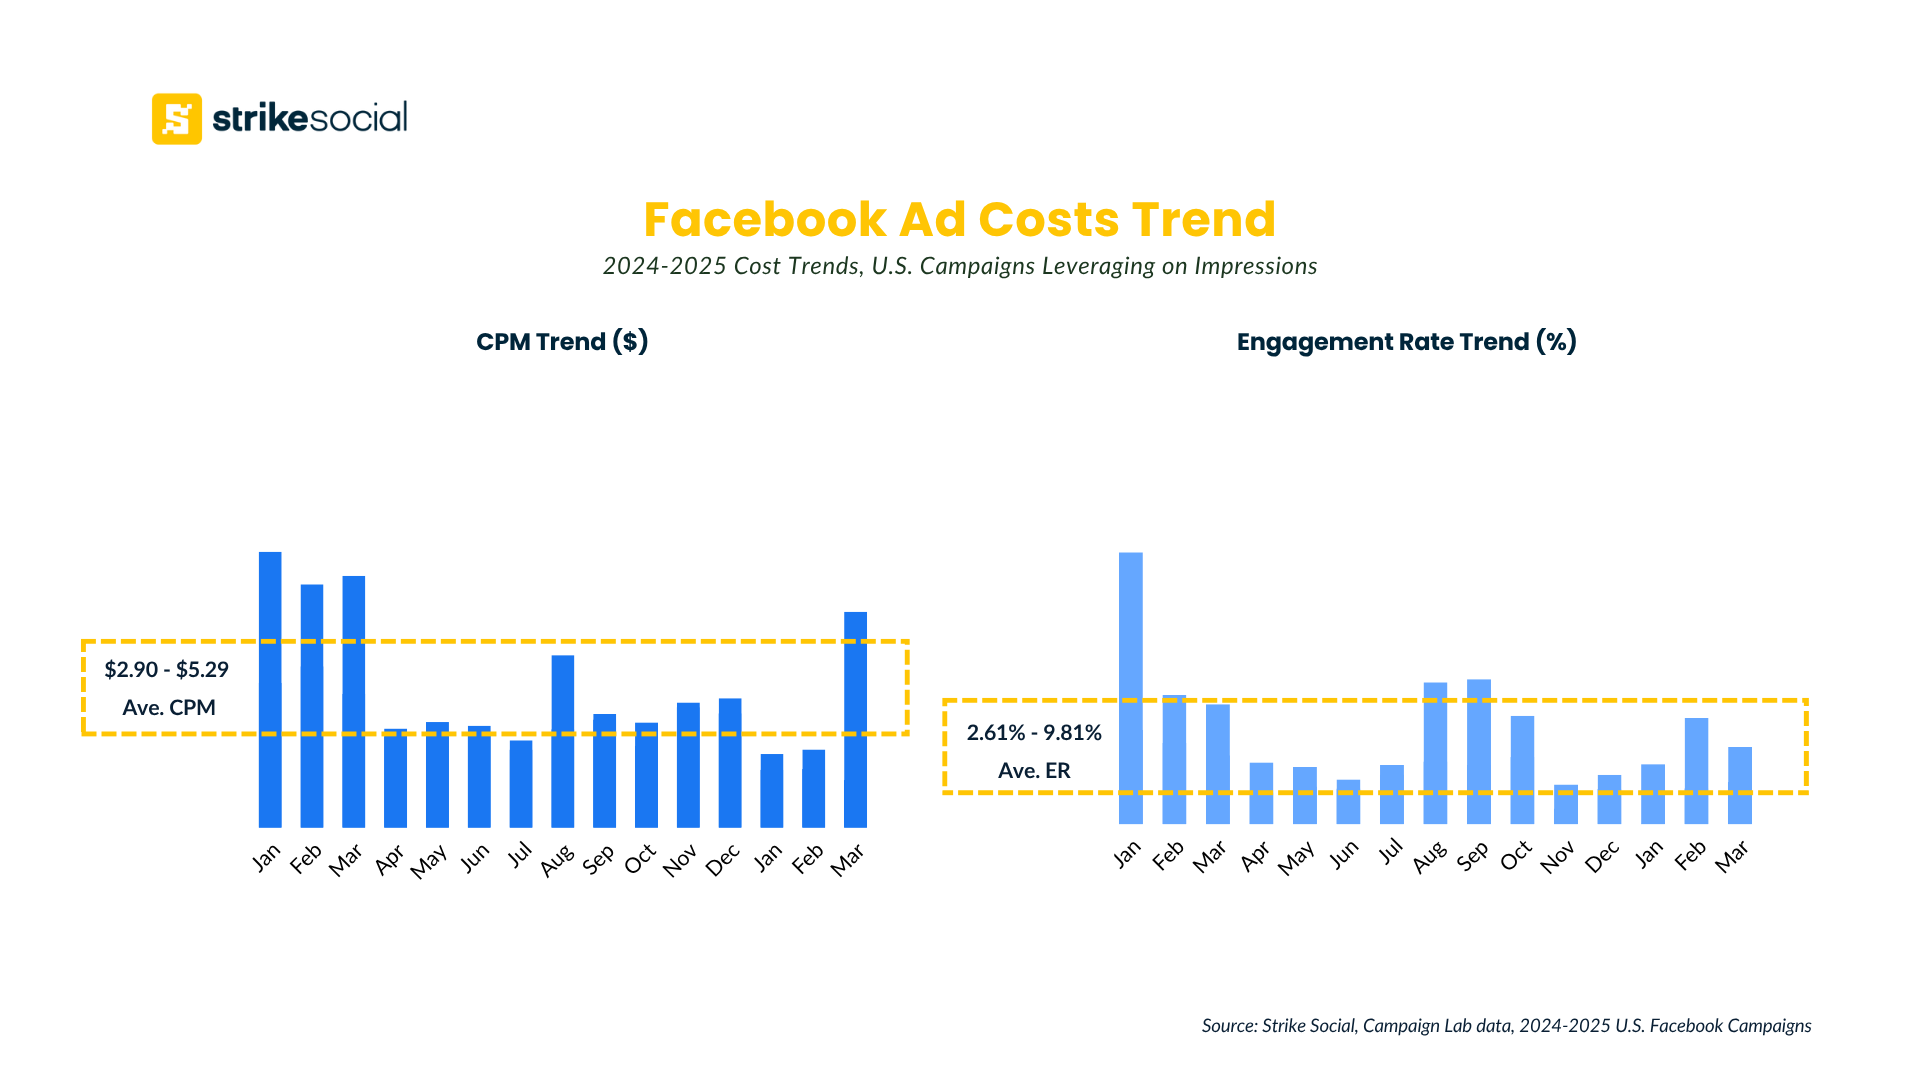
Based on our analysis using Strike Social’s in-house tool, the average Facebook CPM ranges from $2.90 to $5.29 across various industry verticals for US-based campaigns aimed at generating more impressions. This represents a 45% decrease from our 2023 Facebook ad benchmarks; an encouraging sign that Meta’s AI-powered automation, particularly through its Advantage+ Suite, is helping improve cost efficiency for Facebook ads.
While engagement rates for these impression-driven campaigns range from 2.61% to 9.81%, they are slightly lower compared to 2023. Still, these figures suggest that even visibility-focused ads maintain strong attention capture, offering valuable opportunities to engage audiences while managing Facebook advertising costs.
Facebook Ad Strategies for Cost Per Impression (CPM) Metric

Objective: Launching a new product line
Sample Scenario: A client in the consumer electronics industry is launching a new line of smart home devices. Utilizing CPM, the marketing manager can execute a sequence of visually impactful Facebook ads highlighting the advanced functionalities of the products. This approach will enable them to reach a broad demographic on Meta, generating enthusiasm and anticipation for the upcoming launch.
Why use the Cost Per Impression (CPM) Metric: A marketing manager can rapidly utilize CPM (cost per thousand) to reach a wide audience with the new product line. Marketers can effectively generate substantial visibility and interest around the latest products by paying for impressions rather than clicks or views, establishing a solid initial impact. This Facebook advertising strategy proves especially efficacious during the launch phase, aiming to foster brand recognition and interest.
Get the Q1 2025 Facebook Benchmark Report
Explore the latest data on Meta campaign performance—tracking each stage from impressions to conversions. With Advantage+ now taking center stage, see how Facebook campaigns are adapting and performing.
How much is the Cost Per View (CPV) on Facebook?
As media buyers, we are all familiar with Cost Per View (CPV), which denotes the cost to advertise on Facebook associated with each video ad view. This metric is essential for analyzing Facebook video ad campaigns. In addition to CPV, there are other variations of ad cost metrics for standard video ads, including Cost per 2-second continuous video play, Cost per 3-second video play, and Cost per Thru play. However, in this section, our primary focus will be CPV, which drives viewership engagement.
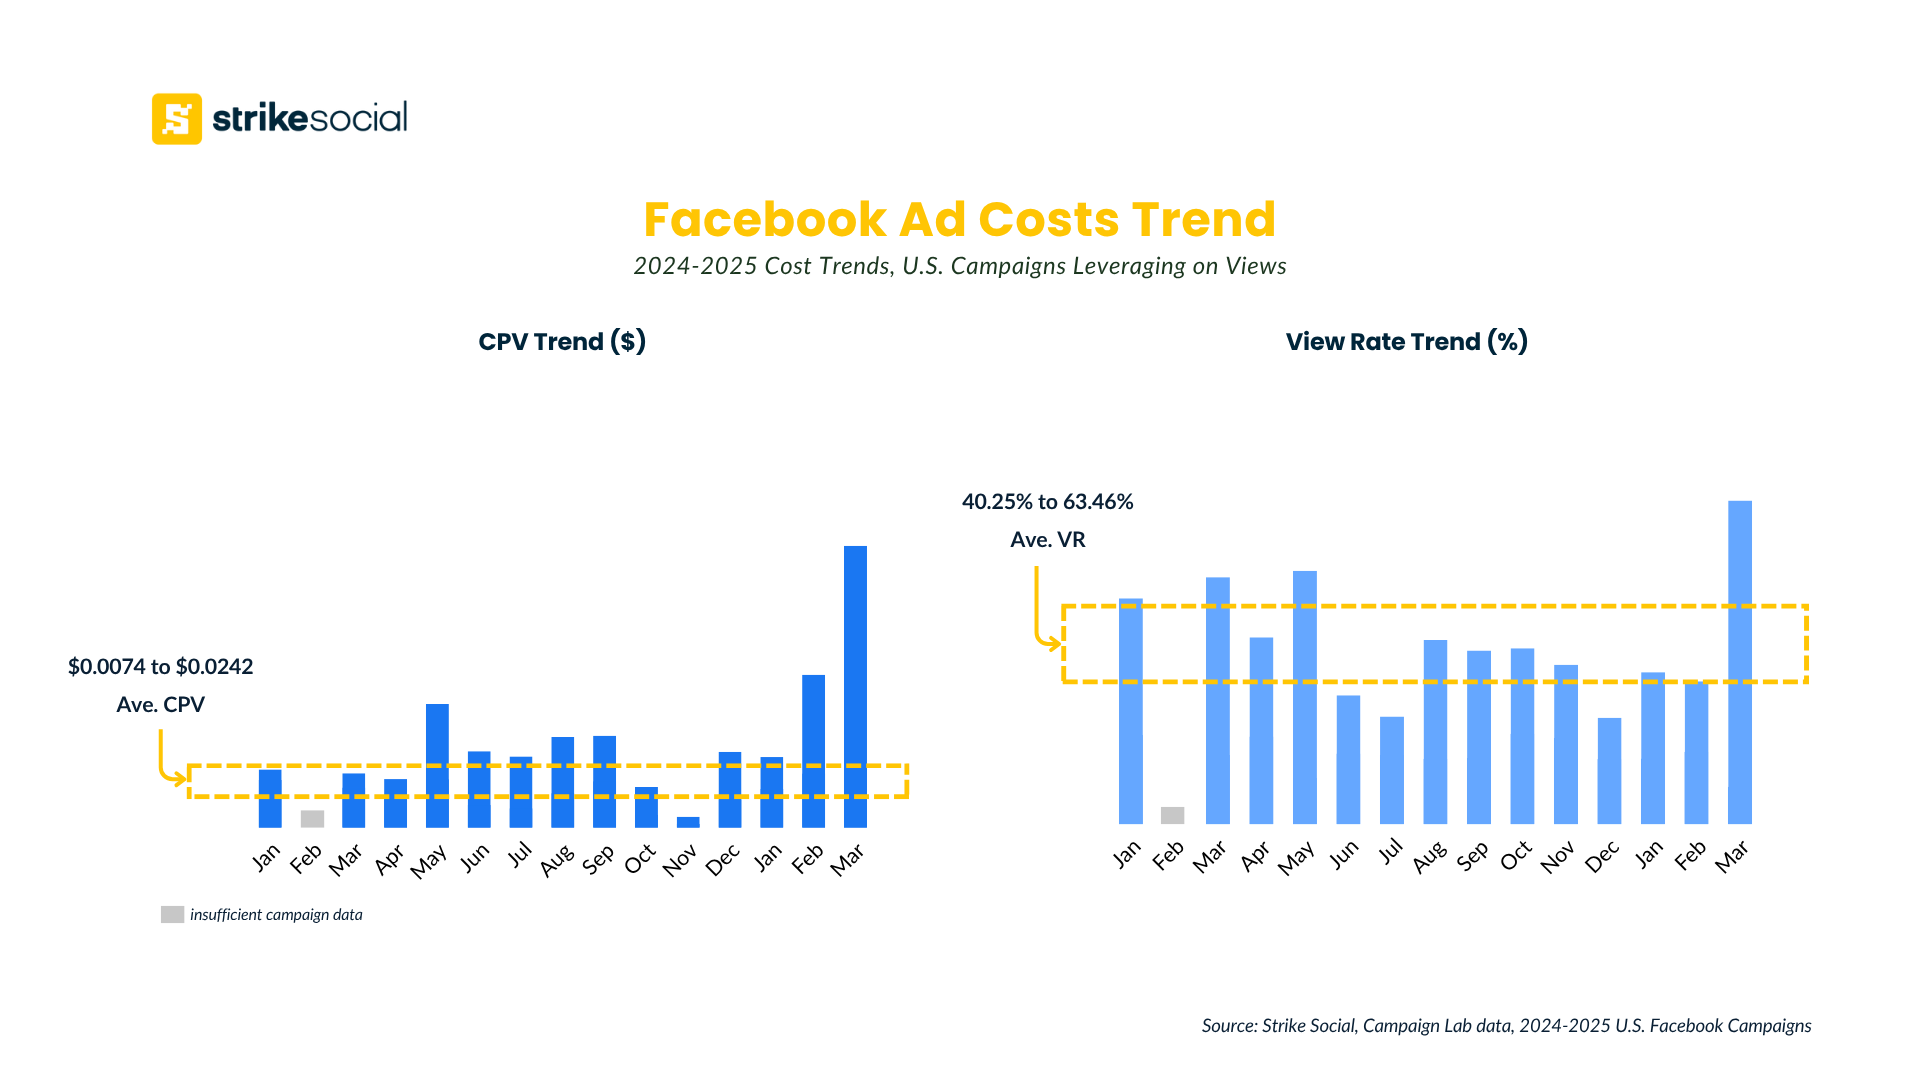
Based on Strike Social’s analysis of U.S.-based, view-focused campaigns, Facebook CPV typically falls between $0.0074 and $0.0242, with view rates ranging from 40.25% to 63.46%. These results vary depending on creative quality, targeting, and placement. As more users engage with Facebook Reels, video ads placed in this environment are proving to be a valuable way to improve cost efficiency and boost visibility.
Sample Facebook Ad Strategy for Cost Per View (CPV) Metric
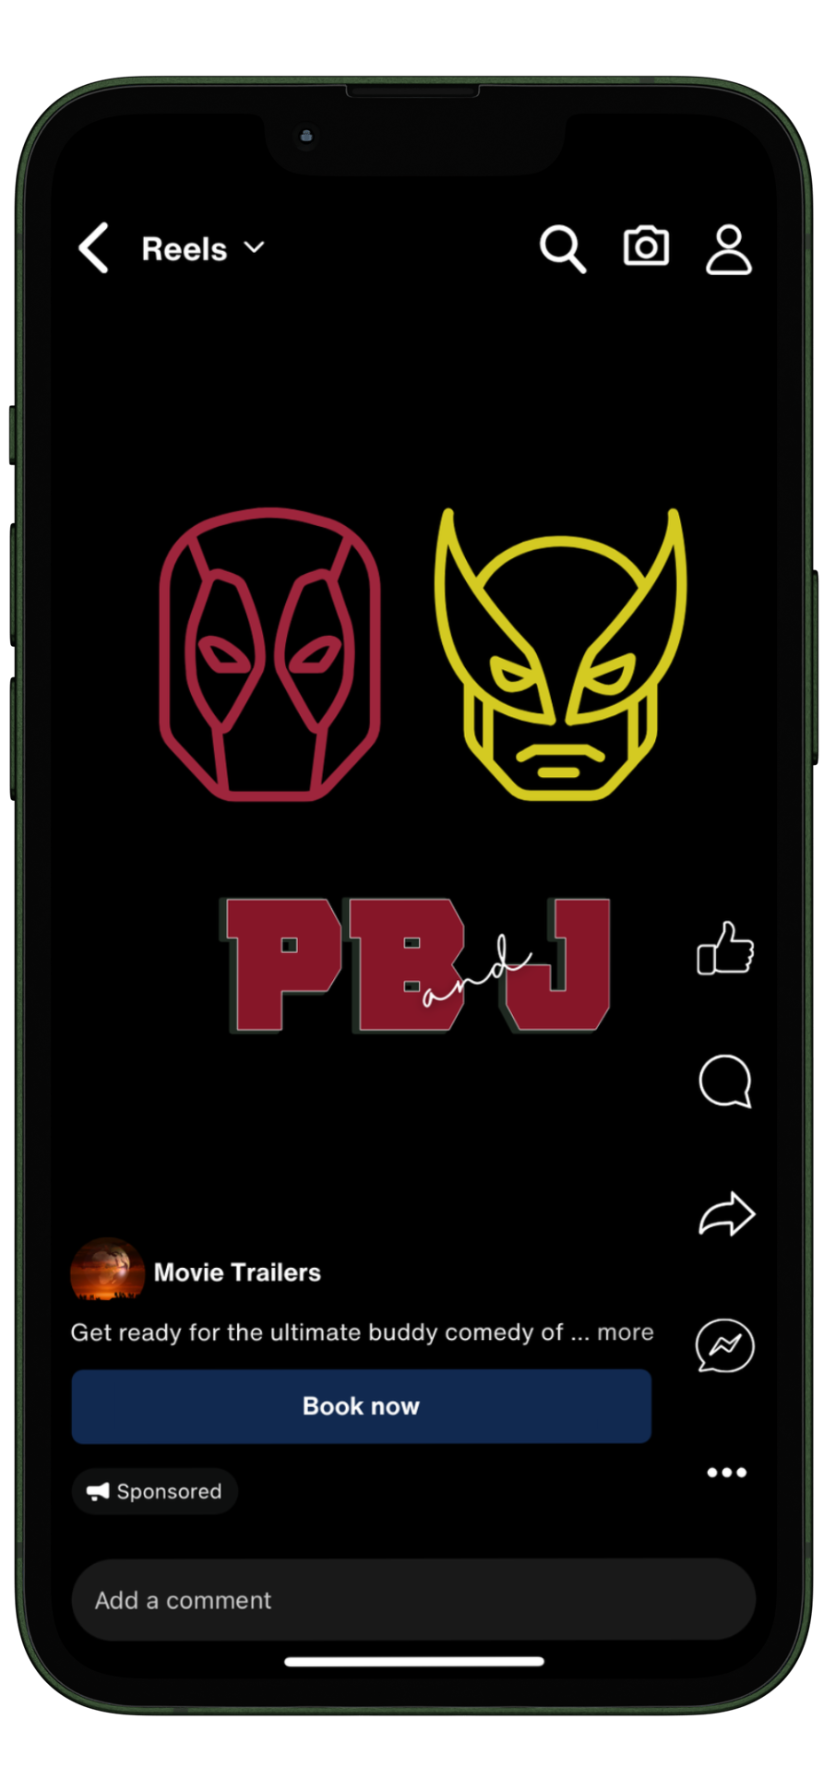
Objective: Increase awareness for a new movie
Sample Scenario: For an entertainment industry client promoting an upcoming blockbuster movie, utilizing a video awareness strategy involves running ads that feature trailers and behind-the-scenes footage. The goal is to generate excitement and anticipation among the target audience. This strategy ensures that video ads are delivered to viewers who are likely to engage with and watch the movie actively.
Why use Cost-Per-View (CPV) Metric: Media buyers can utilize CPV (cost per view) to measure the effectiveness of promotional efforts for the upcoming movie, mainly if a sizable audience sees the ads. By emphasizing views, the team can assess the initial interest and engagement of ad viewers, indicating the level of anticipation and impact of the movie trailer on Facebook users.
How much is the Cost Per Click (CPC) on Facebook?
Cost Per Click (CPC) is the cost incurred by an advertiser each time a user clicks on a Facebook ad. This cost metric is necessary for campaigns focused on driving traffic to websites, landing pages, or specific products. CPC is mainly used for campaigns targeting users in the middle and bottom stages of the sales funnel. Additionally, campaigns that prioritize engagement aim to generate interactions, website visits, or direct responses, utilizing this Facebook ad cost metric.
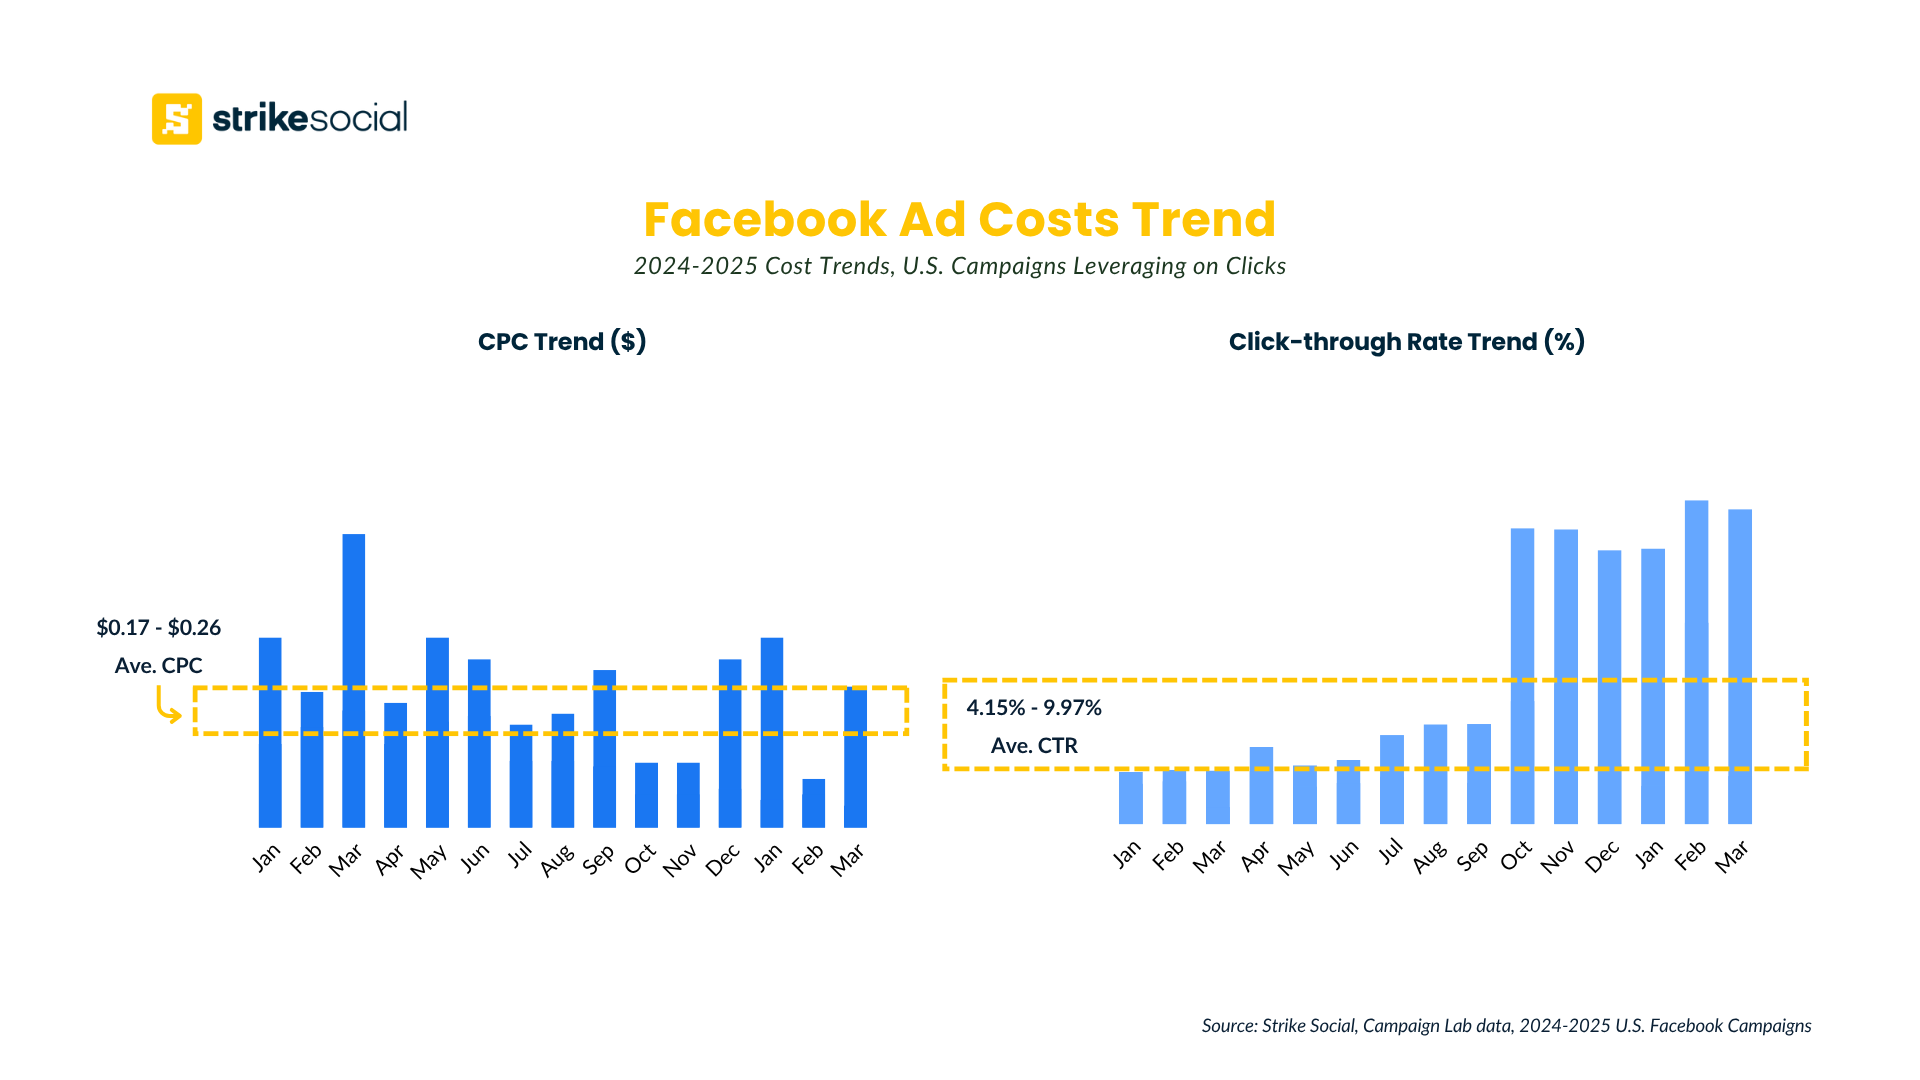
Our analysis of U.S.-based campaigns focused on clicks reveals that CPC typically ranges from $0.17 to $0.26, with click-through rates (CTR) averaging between 4.15% and 9.97%. Compared to our previous benchmark averages, this represents a 64% drop in CPC and a 200% improvement in CTR: a notable shift in both cost-efficiency and campaign performance.
Among placements, Facebook Feed remains a top performer, combining low CPC with strong CTR. While in-stream video also delivers solid engagement, it tends to come at a higher cost per click. These trends reinforce the importance of pairing the right Facebook ad placement strategy with targeting and creative that drives action.
Sample Facebook Ad Strategy for Cost Per Click (CPC) Metric
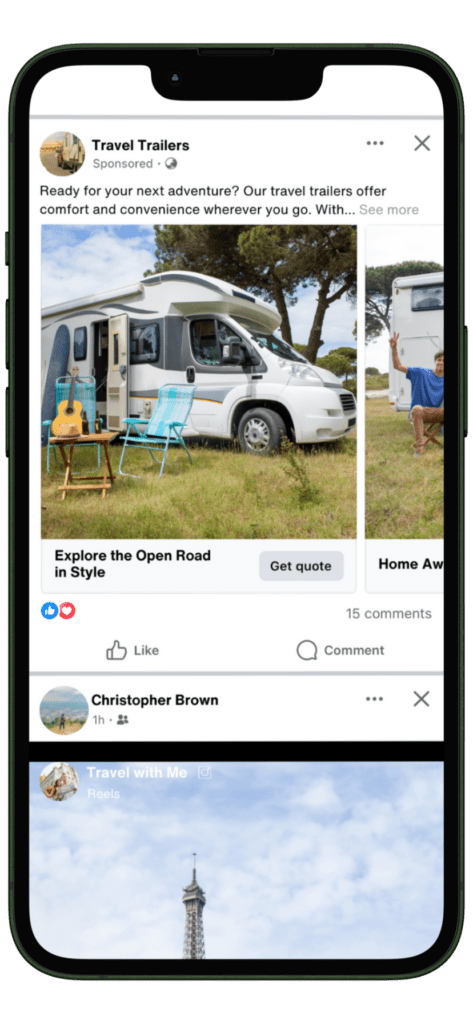
Objective: Promoting time-sensitive offers
Sample Scenario: A travel industry client has initiated a flash sale for holiday packages. The marketing manager has opted to utilize the CPC ad cost metric to evaluate the performance of campaigns by emphasizing time-limited discounts and exclusive offers. This strategy can effectively generate immediate user clicks from individuals interested in capitalizing on the promotion, leading to increased interaction and conversions throughout the sale.
Why Use CPC: Time-sensitive offers require quick action from the target audience. By utilizing the CPC ad metric, media buyers can directly measure and maximize the number of users who click on the ad to take advantage of the offer, focusing on suitable pacing and ad optimization.
Further Reading
What You Need to Know About Meta’s Advantage+ Campaign Budget
With a single campaign budget in place, Meta automatically allocates spend to the highest-performing ads. Here’s what that means for your strategy—and how to fine-tune it for better results.
How Much is the Cost Per Link Click (CPLC) on Facebook?
The Cost Per Link Click (CPLC) is the corresponding cost to advertise on Facebook each time a user clicks on a link within an ad that leads to an external website, landing page, or specific product page. This cost metric is well-suited for campaigns to drive traffic and generate direct engagement with a specified landing page or website. Campaigns prioritizing link clicks strategically focus on converting views into concrete actions, such as website visits, sign-ups, or purchases. These targeted campaigns are typically utilized for consideration or conversion strategies.
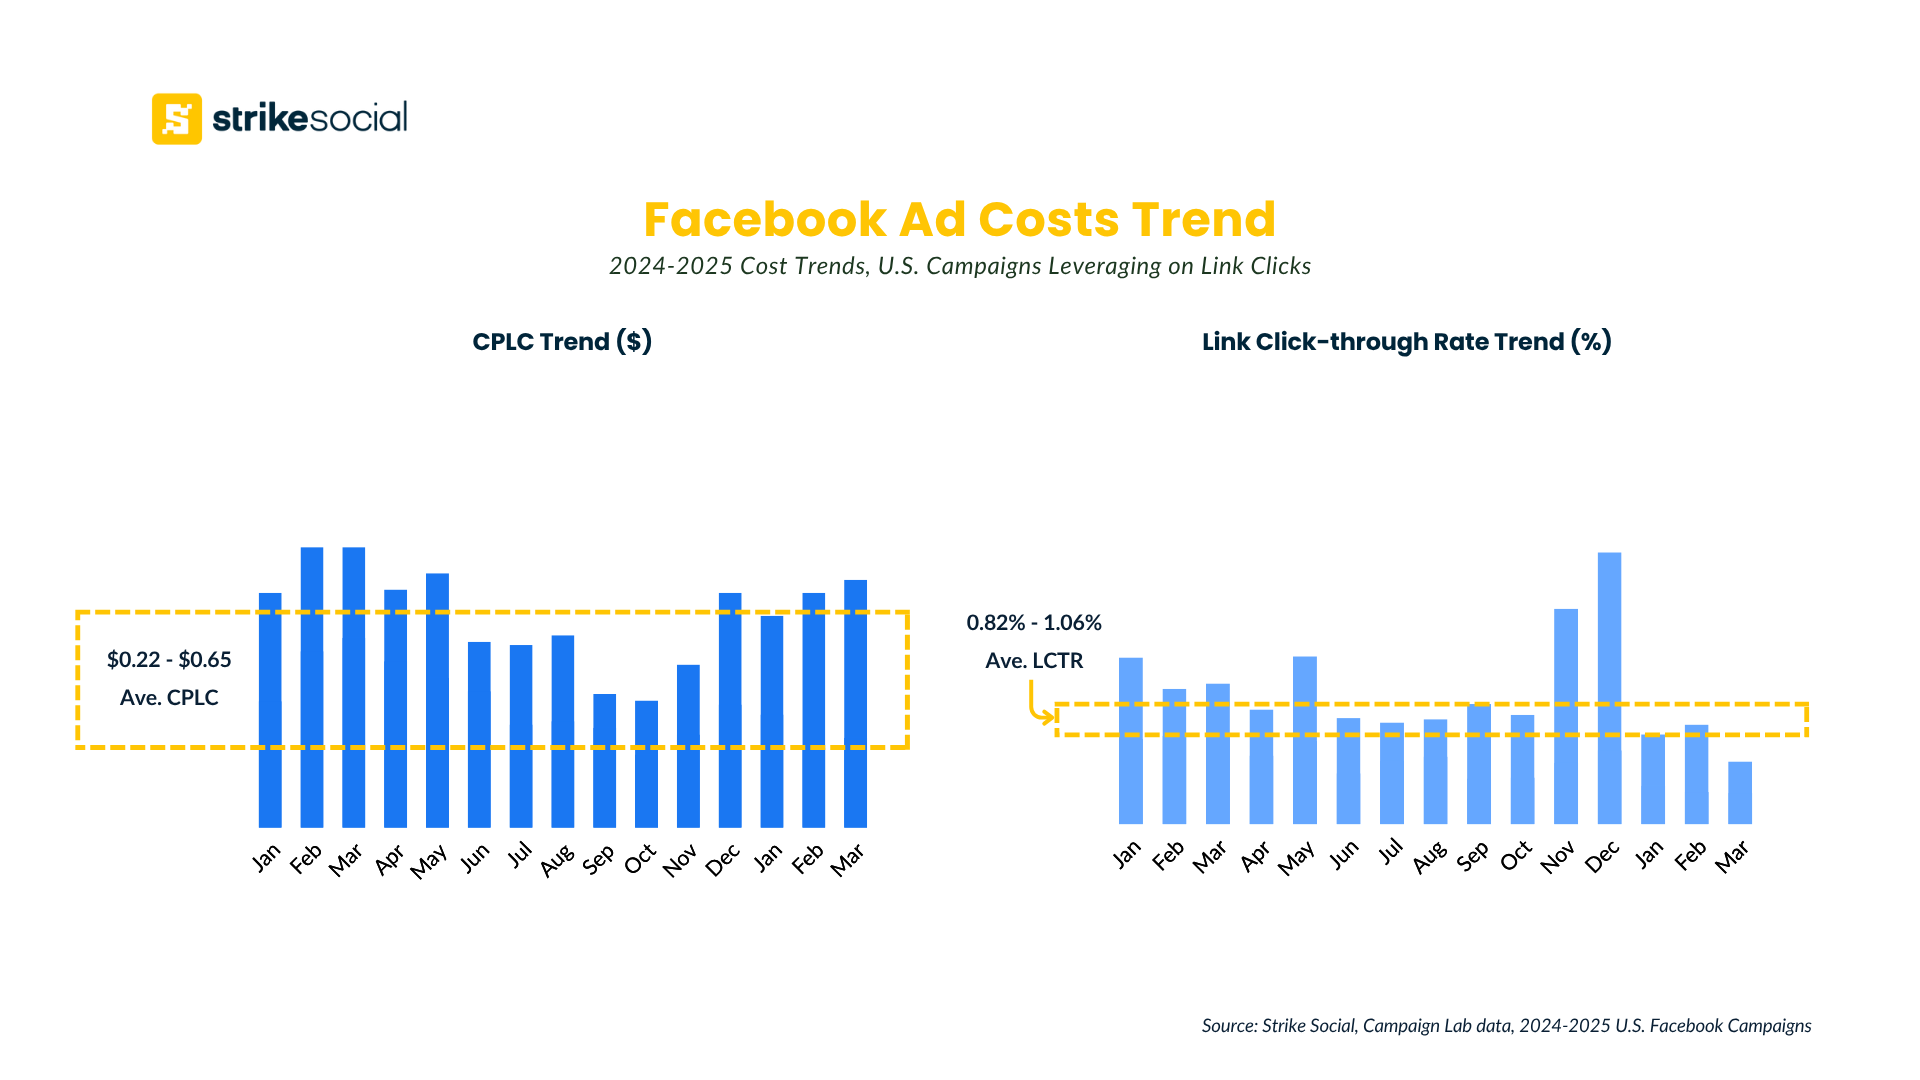
Based on our most recent analysis of US Facebook campaign data focused on link clicks, the average CPLC ranges from $0.22 to $0.65, with link click rates between 0.82% and 1.06%. These results show that even lower-funnel campaigns can benefit from Facebook’s cost-efficient performance, supporting a full-funnel approach for advertisers seeking both reach and results.
Keep in mind that ad auction competitiveness can shift based on seasonal and cultural moments, like holiday shopping seasons or major events such as the Super Bowl, which can cause temporary spikes in Facebook advertising costs due to increased demand and bidding activity.
Sample Facebook Ad Strategy for Cost Per Link Click (CPLC) Metric
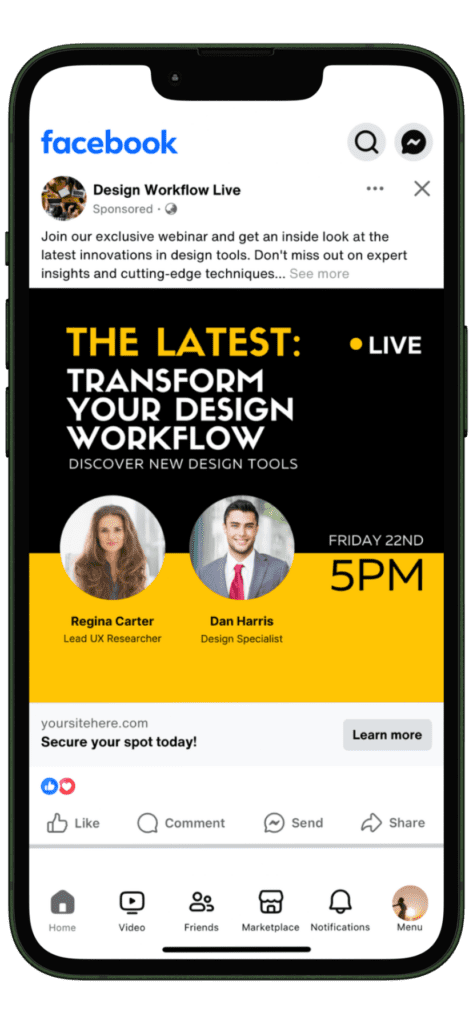
Objective: Drive attendance to an upcoming live stream or online event
Sample Scenario: A prominent client in the technology sector is organizing an annual webinar focusing on the latest developments in design tools. To gauge the effectiveness of ads promoting the event and directing users to the live stream, the digital manager has opted to employ the CPLC cost metric. This strategy aims to optimize live viewer numbers and ensure that ad spend targets users with a high probability of watching the live stream.
Why Use CPLC: CPLC (Cost Per Link Click) is well-suited for this scenario as it emphasizes driving clicks that directly lead to a designated page, such as a livestream page. By paying for each link click, media buyers can effectively allocate ad spend to enhance the outcome of the live event.
How Much is the Cost Per Event Response (CPER) on Facebook?
Cost Per Event Response (CPER) is the cost associated with each user interaction with your event ad, indicating their interest or intention to attend. The CPER cost metric is suitable for campaigns to boost event participation, as it directly measures the advertising’s efficacy in generating RSVPs. CPER is particularly significant when the primary objective is to enhance event turnout and engagement.
According to our data scientists’ analysis, the recent US campaigns aimed at increasing event response rates indicate a potential Cost Per Event Response (CPER) ranging from $0.35 to $1.53. This corresponds to an Event Response Rate of 0.64% to 0.83%. Additionally, media buyers can avail themselves of Facebook’s AI-powered solutions, such as Advantage+ audience and Advantage+ placements, which have been specifically developed to facilitate the efficient management and launch of Facebook ad campaigns.
Sample Facebook Ad Strategy for Cost Per Event Response (CPER) Metric
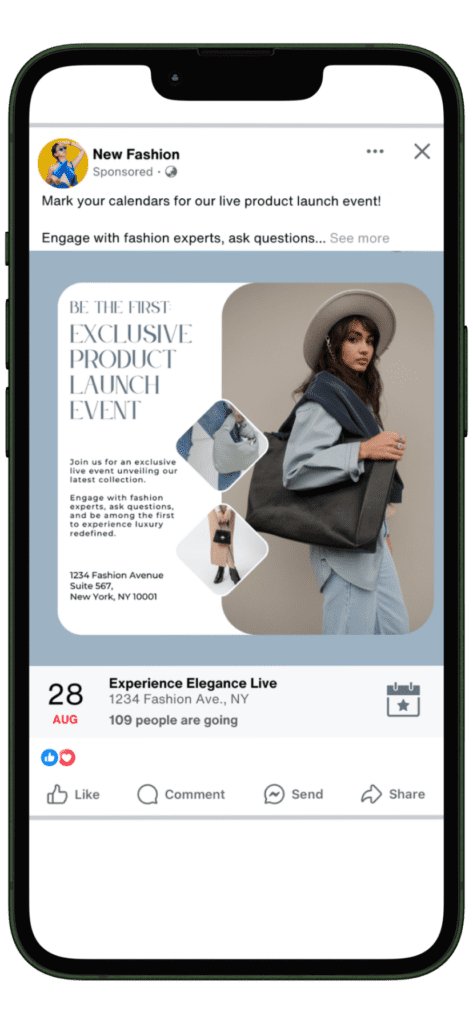
Objective: Maximize attendance at a live product launch event to create buzz and excitement.
Sample Scenario: A client in the fashion industry is introducing a new collection of high-end bags and watches. They are utilizing the CPER cost metric in their digital advertising effort to gauge the effectiveness of ads, encouraging users to attend a live event and providing them with a hands-on experience of the products. This strategy is designed to generate excitement, guarantee strong event attendance, and maximize the impact of the product launch.
Why Use CPER: The CPER model is perfect for this specific situation due to its emphasis on generating responses to the event invitation. By paying only for each successful interaction with the event invitation ads, marketers can be confident that the budget will be utilized efficiently to draw in attendees who have a genuine interest in the upcoming product launch.
Managing Client Expectations with Facebook Ad Costs
When managing Facebook ad campaigns, especially ad costs, effective communication with clients should be at the top of your list. Transparency about ad costs and their alignment with campaign goals is key to setting and managing realistic expectations, building trust, and ensuring clients see the value of their investment.
This blog has extensively covered each cost to advertise on Facebook—CPC, CPM, CPV, CPLC, and CPER. Each metric is specific to the client’s objectives, whether driving traffic, increasing engagement or boosting event participation. Implementing these strategies can significantly enhance campaign outcomes. Strategic use of suitable cost metrics, ad spend optimization, and performance data refinement can pivot an ordinary Facebook ad campaign to an exceptional and deliver high-ROI advertising effort.
Connect with us and revamp your Facebook ad strategies to enhance results and improve efficiency. Our media experts are ready to assist you in navigating the ever-evolving realm of digital advertising.

Article by
Cameron Wallin, Strike Social’s VP of Sales
Cameron combines over six years of startup sales expertise with a deep understanding of video advertising on YouTube, TikTok, and social platforms. He leads Strike Social’s COOP and government partnerships, driving value through compliant, high-performance strategies built for public sector campaigns.


