

Jump to Section
- Start Before Priority Travel Windows
- Match the Media Window to the Campaign’s Job
- Scale Proven Traffic Campaigns When Traffic Signals Improve
- Adapt the APAC Calendar by Platform and Market
- Build Backward From the Next Travel Window
- How Strike Social Applies Live Performance Signals
- Turn the Calendar Into an Active Media Plan
Travel demand and media efficiency do not always peak at the same time.
Across APAC, school holidays, long weekends, festivals, and major events create different travel and booking windows. For advertisers, the challenge is deciding when to build awareness, when to shift campaign objectives, and when stronger intent justifies additional investment.
Travel demand remains strong in key regional markets. Singapore welcomed 16.9 million international visitors in 2025 and expects arrivals to reach between 17 million and 18 million in 2026. Malaysia recorded 42.2 million international visitors in 2025, up 11.2% from the previous year, as Visit Malaysia 2026 began.
Using Strike Social’s Southeast Asia travel campaign data alongside broader APAC benchmarks and campaign examples, the analysis shows that media performance changed by year, objective, platform, and market. Lower impression or click costs could coincide with higher video-view costs, while regional trends often mask significant market differences.
A useful APAC travel advertising calendar must account for both sides of the equation: when traveler intent is likely to build and when campaign performance creates room to act.
Start Before Priority Travel Windows
Travel campaigns are often planned around a destination’s most important dates. These may include a December school break, Lunar New Year, Eid travel, a summer holiday, or a major festival.
Before a priority travel window approaches, advertisers need time to identify which messages resonate, which markets deserve more investment, and which formats can earn attention efficiently. Waiting until demand is already visible leaves less room to test those decisions.
Quarterly CPM movements reinforce why travel dates should not be treated as fixed media-planning rules.
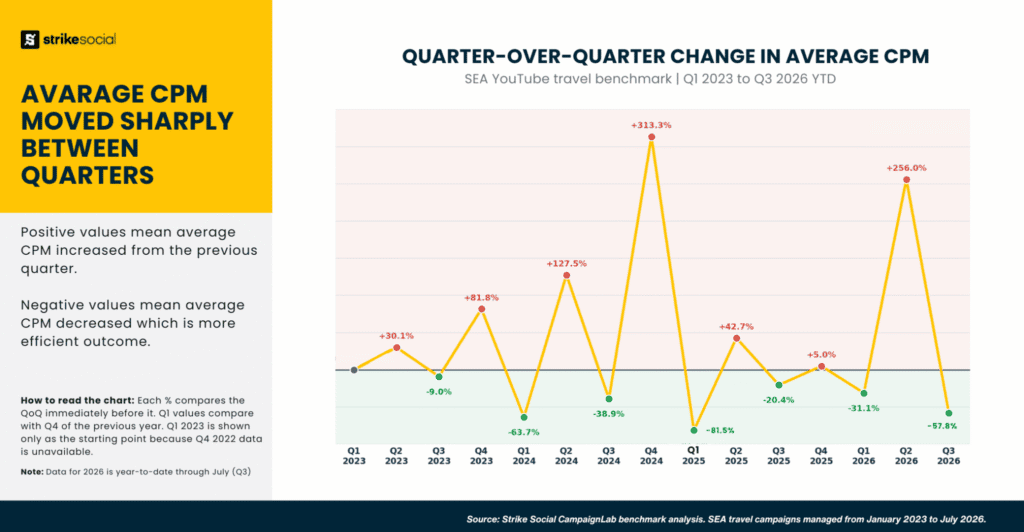
Within the available campaign mix, average CPM declined from Q2 to Q3 in every observed year. The decrease ranged from approximately 9% in 2023 to nearly 58% in 2026 YTD, suggesting that Q3 may provide a useful period for testing and building reach before later travel windows.
Q1 also recorded lower CPM after Q4 in each available year. While that movement may align with reduced auction pressure following year-end activity, the repeated Q3 decline is worth closer attention because it appears across multiple years despite differences in campaign formats, objectives, activity levels, and market mix.
These results should still be treated as directional rather than as a fixed seasonal rule. For travel advertisers, the opportunity is to use historical patterns to identify periods worth testing, then let current campaign performance determine whether additional investment is justified.
Match the Media Window to the Campaign’s Job
“Efficient media” can mean different things depending on what the campaign needs to achieve.
An awareness campaign may need cost-efficient reach, while a video campaign may prioritize the cost and quality of attention. A traffic campaign needs to generate site visits that contribute to searches, enquiries, or bookings. These outcomes do not always improve at the same time.
Strike Social’s 2025 SEA YouTube travel data provides a clear example. From Q3 to Q4:
- Average impression costs declined by nearly 48%.
- Average click costs declined by approximately 87%.
- Average video-view costs increased by approximately 139%.
Q4 created stronger conditions for reach and traffic in the available campaigns, but video views became more expensive. This does not make the quarter universally efficient or inefficient because its value depended on the job the campaign was designed to perform.
The video data reinforces this point. From October to December 2025, Video View Campaign costs more than doubled while view rate declined by more than 22 percentage points.
Travel brands may still need video close to a major booking period, but additional investment should depend on whether attention remains efficient as delivery expands.
Scale Proven Traffic Campaigns When Traffic Signals Improve
The YouTube travel analysis showed that video views became more expensive in Q4 even as impression and click costs declined. Strike Social’s 2024 APAC YouTube traffic benchmark also found that click-through rate exceeded 3% in Q4, more than double the level recorded earlier in the year. In the Philippines, click-through rate reached up to 6% in November.
Selected Google Demand Gen and Meta Link Click campaigns added another view of action-oriented performance during the peak holiday season.
| Platform and campaign | CPC change | CTR change | Additional traffic signal |
|---|---|---|---|
| Google Demand Gen | 14.3% higher | 1.8% higher | Slightly stronger response at a higher click cost |
| Meta Link Clicks | 0.7% higher | 20.2% higher | Landing-page-view rate increased by 24.8% |
Meta produced the stronger improvement, with click-through rate increasing by 20.2% and landing-page-view rate rising by 24.8% while click cost remained nearly unchanged. Google Demand Gen recorded a smaller improvement in click-through rate alongside a 14.3% increase in click cost.
These figures do not confirm bookings, but they show which campaigns produced stronger traffic signals and where advertisers should examine downstream activity, including searches, enquiries, and completed transactions.
Cost also remains central to destination choice. Skyscanner found that 58% of travelers consider flight cost and 57% consider accommodation cost when choosing a destination. Creative used during active planning periods should therefore connect destination inspiration with fares, availability, packages, booking deadlines, and a clear path to the relevant landing page.
In the available campaigns, Q4 provided a stronger case for scaling traffic activity that had already been tested. It should not be the first time the campaign evaluates its message, audience, offer, or landing-page experience.
Adapt the APAC Calendar by Platform and Market
A shared regional travel window should not result in the same platform strategy or budget allocation across all markets.
YouTube awareness and video campaigns can build broad reach and sustained destination storytelling, while Meta traffic campaigns and Google Demand Gen can support re-engagement and site visits closer to active planning periods.
TikTok may play an earlier discovery role through creator-led, platform-native short-form content. That role should still be evaluated against click quality, audience response, and downstream activity before budgets are increased.
Performance also varied by market. Singapore generally recorded higher impression costs than the SEA average across YouTube, Meta, and TikTok, while Malaysia and the Philippines tended to record lower costs. Thailand’s position varied by platform.
These differences may reflect campaign objectives, format mix, competition, audience value, and levels of activity. A lower-cost market is not automatically the most valuable one if the campaign fails to sustain attention or generate useful traffic.
Build Backward From the Next Travel Window
Consider a tourism advertiser preparing for the December school-holiday period. Rather than treating December as the campaign’s starting point, the advertiser can work backward from the travel window and assign a clear decision to each stage.
| Planning stage | Primary decision | What the advertiser should do |
|---|---|---|
| August | Which messages deserve further testing? | Compare how priority origin markets respond to affordability, family experiences, local food, seasonal events, and convenient travel routes. |
| September to October | Which combinations are producing useful signals? | Narrow the plan around the markets, audiences, creative, and platforms generating stronger attention and better-quality traffic. |
| November | Where should additional investment go? | Increase budgets behind proven combinations while reducing spend on campaigns that remain expensive without producing useful site activity. |
| Closer to the travel window | What will help travelers act? | Place greater emphasis on fares, packages, availability, booking deadlines, and clear routes to the relevant landing page. |
By the time demand becomes more visible, the campaign should have a clearer view of which messages, markets, and creative deserve additional investment.
How Strike Social Applies Live Performance Signals
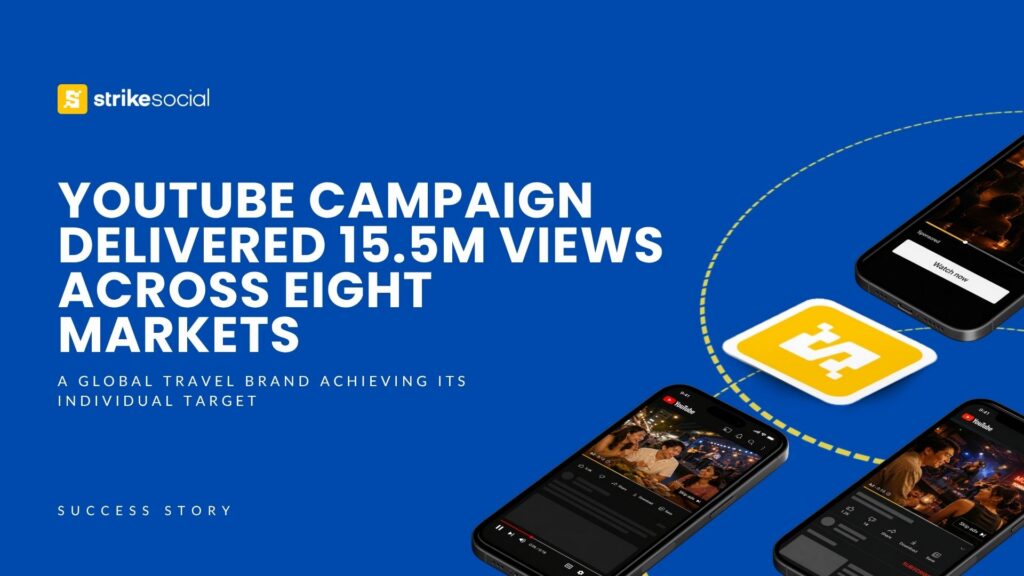
A multi-market travel campaign shows how this approach can work in practice. A global travel brand used YouTube TrueView InStream Skippable to scale one destination story across eight markets in APAC and Europe, with localized campaign elements and individual view targets for each market.
Over 14 days, the campaign delivered 15.5 million views, reached 100.94% of its guaranteed view target, and achieved the individual target in all eight markets. Rather than relying on one regional result, Strike Social monitored the delivery market by market, so stronger performance in one country could not conceal weaker delivery elsewhere.
For travel advertisers managing multiple origin markets, that level of visibility can help determine where creative, targeting, and investment need to change as the campaign progresses.
Further Reading
Delivering 15.5M Views Across Eight Global Markets
A global travel brand partnered with Strike Social to increase viewership for destination content highlighting lesser-known urban experiences through local jazz and live-music culture.
Turn the Calendar Into an Active Media Plan
Historical benchmarks can help travel advertisers set expectations before a campaign begins, but their value increases when those expectations are compared with live performance.
Strike Social combines CampaignLab’s proprietary campaign data with hands-on media management to track results by objective, platform, format, and market while campaigns are still active. When performance moves away from the plan, teams can adjust bids, budgets, audiences, creative rotation, formats, and market allocations before weaker results consume more of the campaign.
The APAC travel advertising calendar should serve as a decision framework rather than a fixed quarterly forecast. It should define each campaign’s role, the benchmarks used to evaluate it, and the signals that justify more investment or a change in direction.

Attending the Mumbrella Travel Marketing Summit?
Schedule a meeting with Strike Social to discuss how regional benchmarks, platform-specific planning, and continuous optimization can support your next APAC travel campaign.
Traveler intent identifies where an opportunity may begin. Historical benchmarks provide context, while live performance determines where investment should move.
Methodology Note
Strike Social’s SEA travel benchmark analysis covers YouTube, Meta, and TikTok campaigns managed across Singapore, Malaysia, the Philippines, and Thailand from January 2023 through July 2026. Results for 2026 are year-to-date.
The dataset includes campaigns with different objectives, formats, levels of activity, and quarter coverage, so the findings should be treated as directional rather than as fixed seasonal benchmarks. TikTok findings are based on a smaller sample of available Landing Page campaigns and are not used to establish broader seasonality.
Cost findings are presented as percentage changes or differences from regional averages to protect client confidentiality. Historical results provide planning context, while campaign decisions should ultimately be based on current performance, market conditions, and business objectives.


